-
Hillmap
- Tour
-

Like us on Facebook Follow us on Twitter
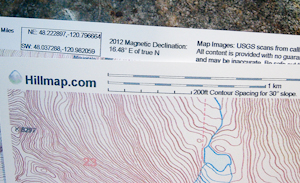
Hillmap.com is the best backcountry mapping app on the web. It combines a selection of the highest quality topographic maps available with data and analysis useful for people who travel far from the beaten path. Read about some of its features below.
Hillmap is a work in progress made by Ryan Bressler and Jen Gregory; email us with questions, comments or bug reports and subscribe to our blog.
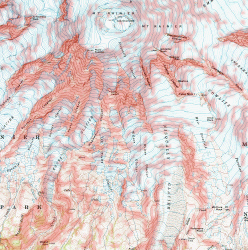
View, Print and Share Free High Quality Topographic Maps
Use the
print tool to print high quality maps.Use the
split screen toggle in the upper left to compare map layers.Use the
link button to share your maps.Use the
search tool to find a named place.Click the
Analyze Terrain Point by Point
Activate the
Pointstab and click the map to measure the elevation, location and slope at a point anywhere in the world. Links to a weather.gov forecast for the point and a peakfinder.org panoramic display of visible named peaks will also appear.Profile and Plan Trips
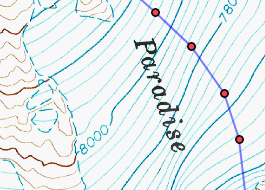
Use the
Pathstab to construct and measure a route or trail.Paths can be imported from and exported to GPX files for use with a GPS via drag and drop or the
Toolsmenu.Highlight Avalanche Prone Slopes
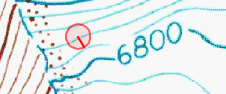
Avalanches are most common on slopes steeper then 28 °. Hillmap provides four ways to analyze slope angles.
- Use the
Pointstab to check the slope at a point anywhere in the world. - In the
Pathstab the overall slope of the last line added to the path is displayed to assist in measuring longer paths. - Use the
Slope Analysislayer on theOverlaystab underData Layersto do custom slope analysis for anywhere in the US. - Caltopo slope layers for the US are also on the
Overlaystab.
Examples and Tutorials
- Use the
-
- Points
- Paths
- Overlays
- Tools
- Settings
- ? Information
Zoom in to see the circle sampled to calculate slope, the line inside the circle points in the steepest direction.